Optimize Postgres Query Performance Using EXPLAIN ANALYZE: A Comprehensive Guide
PostgreSQL, often referred to as Postgres, is a powerful, open-source relational database system known for its robustness and flexibility. However, like any database, it can suffer from performance issues, particularly when it comes to executing complex queries. One of the most effective tools for diagnosing and optimizing query performance in Postgres is the EXPLAIN ANALYZE command. This comprehensive guide will explore how to leverage this command to enhance your database's performance.
Understanding EXPLAIN ANALYZE
The EXPLAIN command in PostgreSQL provides insight into how a query will be executed, detailing the execution plan that the database will use. When combined with ANALYZE, it not only shows the planned execution path but also executes the query, providing actual run-time statistics. This combination is invaluable for understanding where bottlenecks may occur.

What Does EXPLAIN ANALYZE Show?
When you run EXPLAIN ANALYZE, you receive a wealth of information about the query execution. This includes:
- Execution Time: The total time taken to execute the query.
- Planning Time: The time spent planning the execution strategy.
- Rows Processed: The number of rows processed at each step of the execution.
- Cost Estimates: An estimation of the resources required for each operation.
Understanding these metrics is crucial for identifying performance issues. For instance, if a particular operation takes significantly longer than expected, it may indicate that an index is missing or that the query could be optimized. Additionally, the output of EXPLAIN ANALYZE can help you visualize the flow of data through various operations, such as sequential scans, index scans, and joins, allowing for a deeper analysis of how data is accessed and processed.
How to Use EXPLAIN ANALYZE
Using EXPLAIN ANALYZE is straightforward. Simply prepend the command to your SQL query. For example:
EXPLAIN ANALYZE SELECT * FROM users WHERE age > 30;This command will execute the query and return the execution plan along with detailed timing information. It's important to note that because the query is executed, it may modify data if the query includes INSERT, UPDATE, or DELETE statements, so caution is advised. Furthermore, you can enhance your analysis by using additional options with EXPLAIN, such as BUFFERS, which provides insights into the memory usage during the execution, or VERBOSE, which gives more detailed information about the plan nodes.
In practice, EXPLAIN ANALYZE can be an essential tool in the database administrator's toolkit. By regularly analyzing slow-running queries, you can iteratively refine your database schema and query designs. This not only improves performance but also enhances user experience by reducing response times. As you become more familiar with interpreting the output, you’ll find that you can quickly pinpoint inefficiencies and apply targeted optimizations, leading to a more robust and efficient database system.
Interpreting the Output
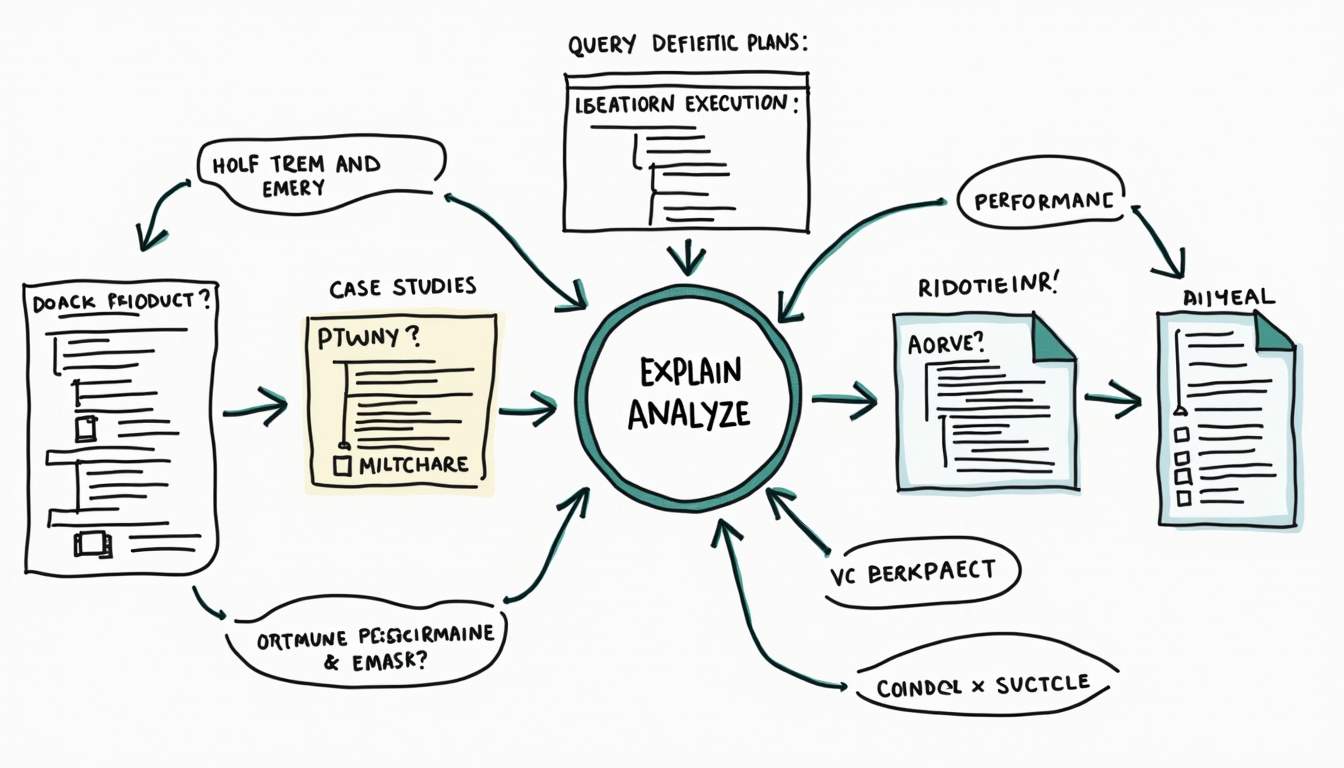
The output of EXPLAIN ANALYZE can be complex, but breaking it down into manageable parts can help. The output is typically presented in a tree-like structure, where each node represents a step in the execution process.
Key Components of the Output
Understanding the key components of the output is essential for effective query optimization:
- Node Type: Indicates the type of operation (e.g., Seq Scan, Index Scan, Join).
- Actual Time: Shows the time taken for each operation.
- Rows: Displays the number of rows processed at each step.
- Loops: Indicates how many times the operation was executed.
By analyzing these components, it becomes easier to identify which parts of the query are performing poorly. For example, if a Seq Scan is being used instead of an Index Scan, it may be worth investigating whether an appropriate index exists.
Common Patterns to Look For
When interpreting the output, several common patterns can indicate potential issues:
- High Actual Time: If a node shows a high actual time, it may indicate a performance bottleneck.
- Large Number of Rows: A node processing a large number of rows can suggest inefficiencies in filtering or joining data.
- Repeated Loops: If a node has a high loop count, it may indicate that the query is not efficiently structured.
Moreover, it is crucial to consider the context in which these patterns arise. For instance, a high actual time in a node that processes a small number of rows might not be as concerning as a similar metric in a node that handles a large dataset. This distinction can guide you toward more targeted optimizations. Additionally, examining the execution plan in conjunction with the database schema and indexing strategy can provide deeper insights into how to improve query performance.
Another important aspect to consider is the impact of database configuration settings on the execution plan. Parameters such as work_mem, effective_cache_size, and random_page_cost can influence how the query planner decides to execute a query. By adjusting these settings, you may be able to achieve better performance, especially for complex queries that involve multiple joins or aggregations. Therefore, understanding both the output of EXPLAIN ANALYZE and the underlying database configuration can empower you to make informed decisions for query optimization.
Optimizing Queries Based on EXPLAIN ANALYZE Output
Once the output of EXPLAIN ANALYZE has been interpreted, the next step is to implement optimizations. There are several strategies that can be employed to enhance query performance.
Indexing Strategies
One of the most effective ways to improve query performance is through indexing. Properly designed indexes can significantly reduce the time it takes to retrieve data. Consider the following:
- Single-Column Indexes: Create indexes on columns that are frequently used in WHERE clauses.
- Multi-Column Indexes: For queries that filter on multiple columns, consider creating composite indexes.
- Partial Indexes: If a query only needs to filter a subset of data, a partial index can be more efficient.
After creating or modifying indexes, it’s beneficial to rerun EXPLAIN ANALYZE to see how the execution plan has changed and whether performance has improved.
Query Restructuring
Sometimes, simply restructuring the query can lead to significant performance gains. Here are a few techniques:
- Use of Joins: Ensure that joins are done on indexed columns and consider using INNER JOIN instead of OUTER JOIN when possible.
- Subqueries vs. Joins: Evaluate whether subqueries can be replaced with joins, as joins are often more efficient.
- Limit Result Sets: Use the LIMIT clause to restrict the number of rows returned, especially during testing.
After making these changes, running EXPLAIN ANALYZE again will help in assessing the impact of the modifications.
Advanced Techniques for Performance Tuning
Beyond basic indexing and query restructuring, there are advanced techniques that can further enhance PostgreSQL performance.

Configuration Tuning
PostgreSQL has numerous configuration settings that can be tuned for better performance. Some key parameters include:
- work_mem: This setting controls the amount of memory used for internal sort operations and hash tables before writing to disk. Increasing this value can improve performance for complex queries.
- shared_buffers: This parameter determines how much memory is dedicated to caching data. A higher value can enhance performance, especially for read-heavy workloads.
- effective_cache_size: This setting informs the query planner about the amount of memory available for caching data, influencing its choice of execution plans.
Adjusting these parameters requires careful consideration and should be tested in a staging environment before applying to production.
Using EXPLAIN (BUFFERS)
For deeper insights into how queries interact with disk I/O, using EXPLAIN (BUFFERS) can be beneficial. This option provides additional information about buffer hits and misses, helping to identify whether a query is efficiently utilizing cached data.
For example:
EXPLAIN (ANALYZE, BUFFERS) SELECT * FROM orders WHERE order_date > '2023-01-01';This command will show how many buffers were read from disk versus how many were found in memory, allowing for further optimization based on I/O patterns.
Real-World Examples of Optimization
To illustrate the effectiveness of EXPLAIN ANALYZE in optimizing queries, consider the following real-world scenarios.

Example 1: Slow Query with Missing Index
A query that retrieves user information based on their email address may perform poorly if there is no index on the email column:
SELECT * FROM users WHERE email = 'example@example.com';Running EXPLAIN ANALYZE might reveal a sequential scan:
Seq Scan on users (cost=0.00..35.00 rows=1 width=256) (actual time=0.123..0.123 rows=1 loops=1)Creating an index on the email column:
CREATE INDEX idx_users_email ON users(email);After indexing, rerunning the EXPLAIN ANALYZE command would likely show an index scan, significantly reducing the execution time.
Example 2: Complex Join Optimization
In a scenario where multiple tables are joined, performance can suffer if the join conditions are not optimized. Consider a query that joins orders and customers:
SELECT * FROM orders o JOIN customers c ON o.customer_id = c.id WHERE c.country = 'USA';Running EXPLAIN ANALYZE may show a large number of rows being processed:
Hash Join (cost=0.00..1000.00 rows=1000 width=512) (actual time=10.123..10.456 rows=500 loops=1)By ensuring that both customer_id and id are indexed, and perhaps restructuring the query to filter on the customers table first, the performance can be drastically improved.
Conclusion
Optimizing query performance in PostgreSQL is a critical skill for database administrators and developers alike. By utilizing the EXPLAIN ANALYZE command, one can gain deep insights into query execution plans and identify performance bottlenecks. Through strategic indexing, query restructuring, and advanced tuning techniques, significant improvements can be achieved.
Regularly analyzing and optimizing queries not only enhances application performance but also contributes to a better user experience. As databases grow and evolve, maintaining optimal performance becomes an ongoing task that requires attention and expertise.
Incorporating the strategies discussed in this guide will empower users to harness the full potential of PostgreSQL, ensuring that their applications run efficiently and effectively.
Take Your Database Performance Further with Engine Labs
Now that you're equipped with the knowledge to optimize your PostgreSQL queries, why not elevate your software development process as well? Engine Labs is here to transform the way your team builds software, integrating effortlessly with tools like Jira, Trello, and Linear to automate up to 50% of your tickets. Say goodbye to the bottleneck of backlogs and embrace accelerated development cycles with Engine. Ready to revolutionize your software engineering workflow and ship projects faster? Get Started with Engine Labs today.


